Gaining Insights with the Statistics Dashboard
You’ll find the Statistics Dashboard under the Internal Link Juicer’s “Dashboard” section. Let’s explain how to get to everything you’re looking for.
-
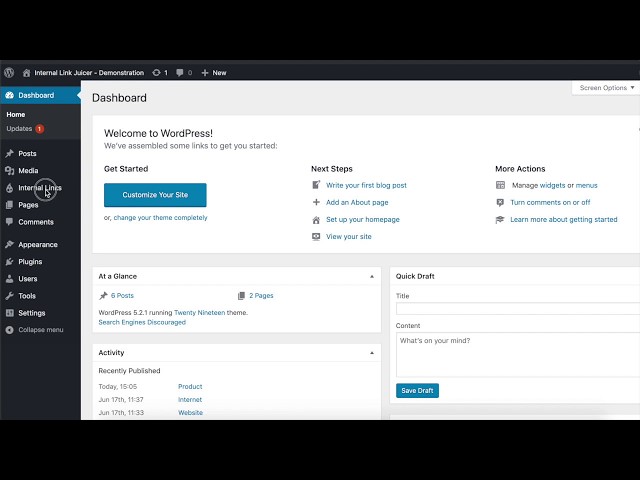
Click on the “Dashboard” tab
Once you’re in the Internal Link Juicer, click on the “Dashboard” tab. Here you’ll see lots of different information.
-
Scroll down to the Statistics Dashboard
To get to the Statistics Dashboard, simply scroll down once you’re on the “Dashboard” tab. Here’s where you can see your link statistics.
-
Optimize your links using the Filter, Order and Sort features
To better understand your link performance, you can organize the information using the Filter, Order, and Sort features. These three commands will help you visualize data and find relevant insights about your links.
All About the Statistics Dashboard
Ready to dive into your link data? It’s time to show you around the Statistics Dashboard, so you can easily find the information you need to optimize your links. You’ll see two different tabs in the Dashboard, each with different sets of information.
Link Statistic Tab
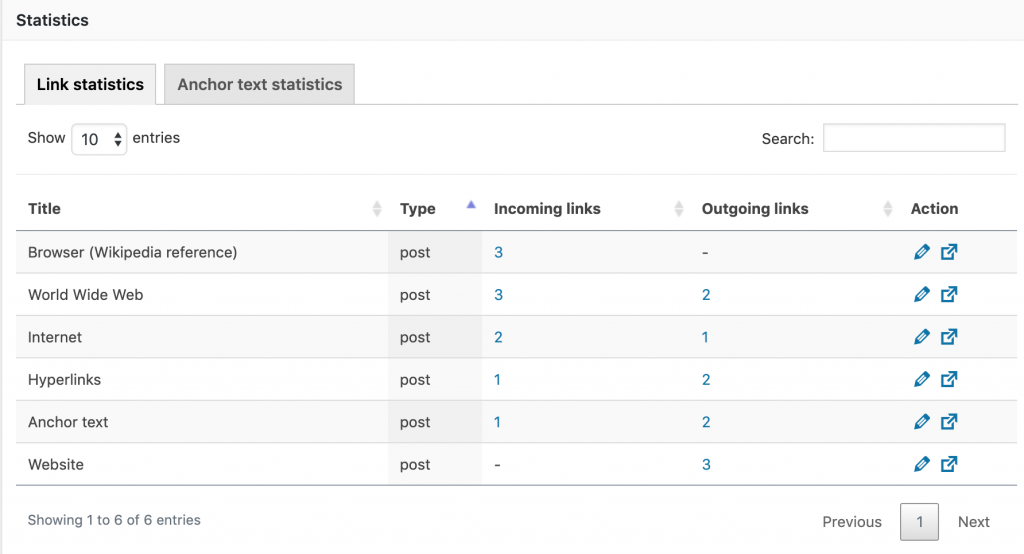
Once you’re in the Dashboard, you’ll see the Link Statistics Tab. This tab gives you information about the links built with the plugin. You can sort this table by using the arrows next to titles. For example, you can sort by incoming or outgoing links. You can also use the search field to find a specific link.
Besides these basic commands, you can also click on any link and get more insights for it:
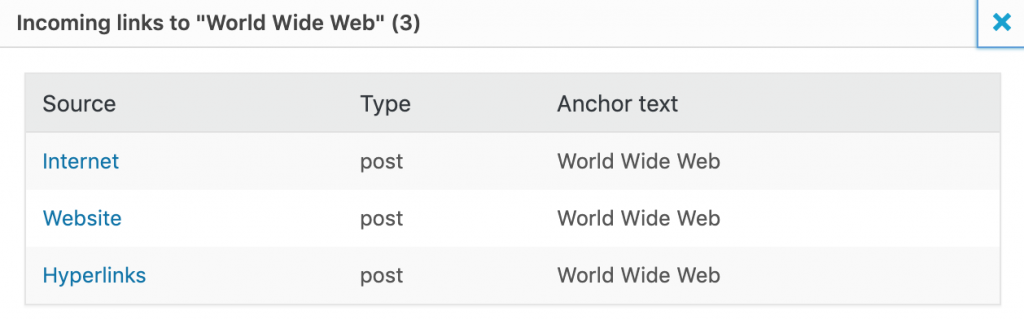
Here you can see the linking structure for each post. For example, for the link “World Wide Web”, you can see the posts linking to it and the anchor text for each one. In this case, there are three posts linking to “World Wide Web”, each with the anchor text “World Wide Web”.
Anchor Text Tab
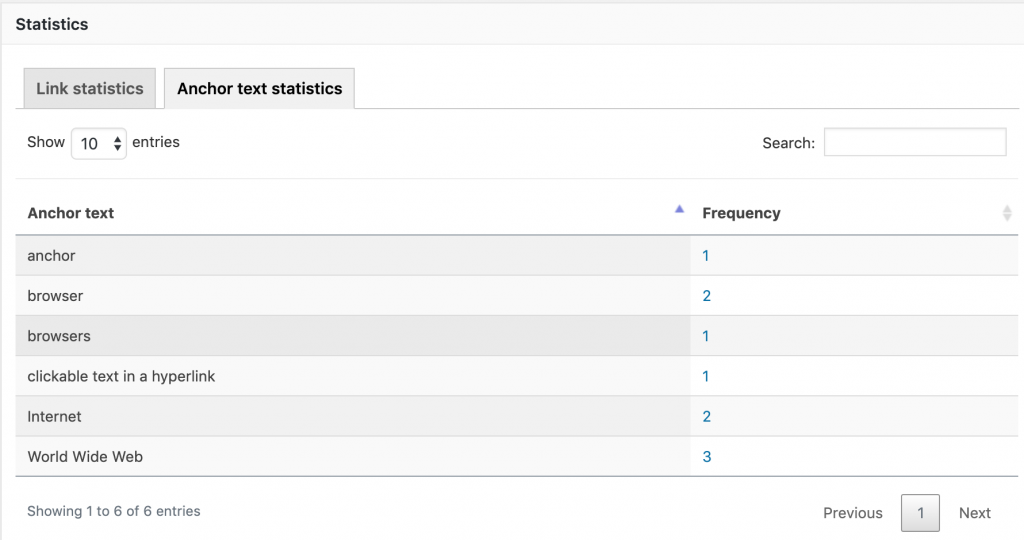
The second tab on the Statistics Dashboard is the Anchor Text Tab. Here’s where you can get information about the anchor text used for incoming or outgoing links. You can visualize this data by sorting it by the most or least used anchor texts. You can also filter the anchor texts by searching for your desired keyword.
Examples of Using the Statistics Dashboard
Let’s wrap up this guide with some examples of how to use the Statistics Dashboard. Now that you have all the information at your fingertips, we’ll explain how to use it to optimize your internal linking. These tips will help you maximize your work with the plugin and can help you create a weekly workflow for improving your links.
Insight #1: Your content has lots of incoming links, but few outgoing links
In this case, you have an important post on your site, which gets linked to very often. However, this means you have an opportunity to boost outgoing links and link to other posts to better enhance this post’s linking power.
What to do: Go into the editor for this post and add more relevant content that will have a chance of getting automatically linked to other posts via keywords. In this way, you can enhance outgoing links and optimize the content for better distribution of linking power.
Insight #2: Your post has lots of outgoing links, but few incoming links
This is the opposite issue of the first insight. In this case, your post is a huge opportunity for distributing link juice and connecting different pages. To make the most of this link hub, you should optimize the content for more incoming links.
What to do: Go to the editor for this post and add more relevant keywords to the keyword editor to create more incoming links.
Use insights from the Statistics Dashboard and optimize your content to great effect!